سجّلت الصادرات الوطنية السعودية غير البترولية نمواً بنسبة 8.5% خلال أغسطس 2026، مقارنة بالشهر المماثل من العام الماضي، في مؤشر إيجابي يعكس استمرار نمو الصادرات الوطنية بعيداً عن القطاع النفطي، وتنامي مساهمة المنتجات السعودية في حركة التجارة الدولية.
وكشفت بيانات الهيئة العامة للإحصاء، الصادرة ضمن تقرير التجارة الدولية السلعية، ارتفاع نسبة الصادرات غير البترولية، شاملة إعادة التصدير، إلى الواردات لتبلغ 36.51%، مقابل 36.48% في أغسطس 2025، بما يعكس تحسناً طفيفاً في هذا المؤشر التجاري.
اللدائن والكيماويات في الصدارة
وتصدّرت اللدائن والمطاط ومصنوعاتهما قائمة الصادرات غير البترولية، مستحوذة على 22.6% من إجماليها، بعد تسجيل نمو سنوي بنسبة 7.5%، فيما حلّت منتجات الصناعات الكيماوية في المرتبة الثانية بحصة بلغت 20.9%.
وتعكس هذه النتائج استمرار حضور المنتجات الصناعية السعودية في الأسواق الخارجية، خصوصاً في القطاعات المرتبطة بالصناعات التحويلية والبتروكيماوية.
الإمارات وكوريا والهند.. أبرز الأسواق
وعلى صعيد الشركاء التجاريين، تصدّرت الإمارات العربية المتحدة وجهات الصادرات السعودية بحصة بلغت 11.4%، تلتها كوريا الجنوبية بنسبة 11.2%، ثم الهند بنسبة 8.4%.
واستحوذت أكبر 10 وجهات تصديرية على 64.5% من إجمالي الصادرات السلعية للمملكة، ما يعكس أهمية هذه الأسواق في حركة التجارة الخارجية السعودية.
ميناء جدة يتصدر منافذ التجارة
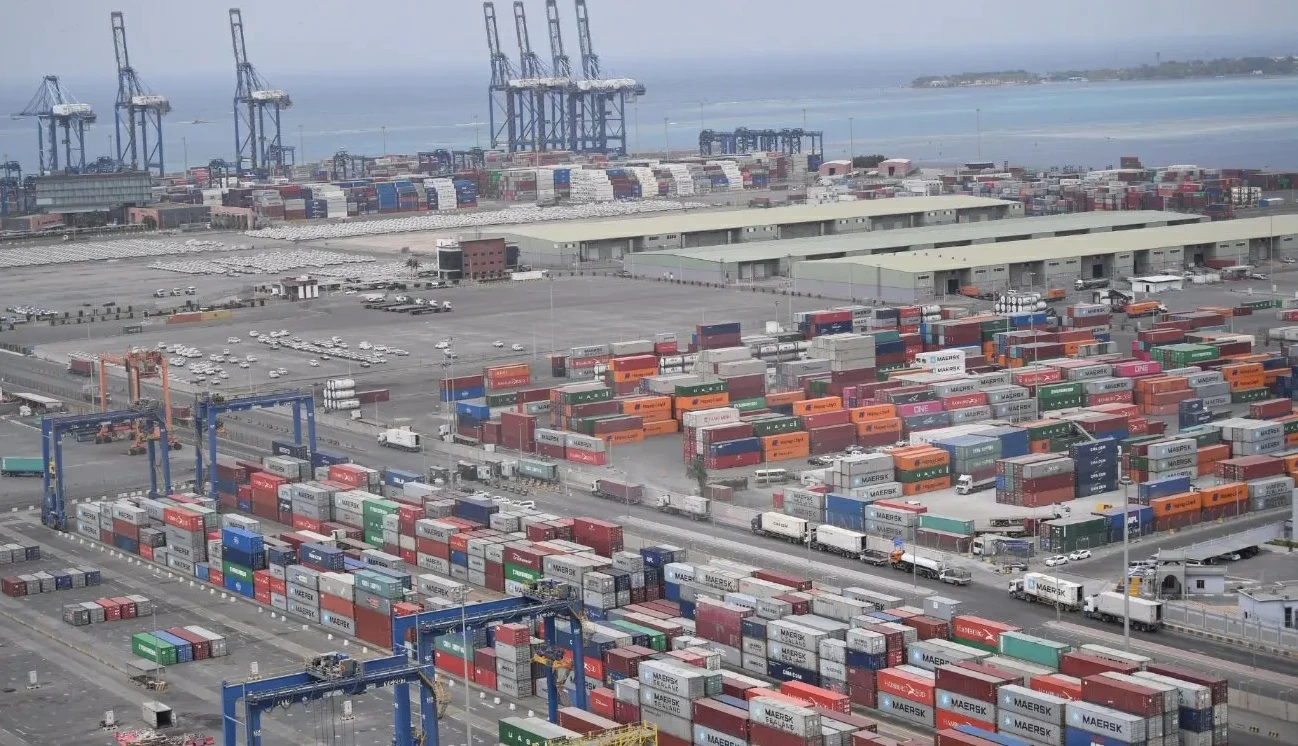
وبرز ميناء جدة الإسلامي بوصفه المنفذ الأبرز لحركة التجارة السلعية، بعدما استحوذ على 46.7% من إجمالي الواردات، إلى جانب تصدّره منافذ الصادرات غير البترولية بحصة بلغت 27.5%، في مؤشر يعكس مكانته المحورية في منظومة النقل والخدمات اللوجستية بالمملكة.
تراجع الواردات 9.1%
وفي مؤشر آخر، أظهرت البيانات انخفاض الواردات السلعية بنسبة 9.1% خلال أغسطس الماضي، فيما تراجعت الصادرات السلعية الإجمالية بنسبة 11.5%، متأثرة بانخفاض الصادرات البترولية بنسبة 12.5%.
كما انخفض فائض الميزان التجاري بنسبة 21% على أساس سنوي.
الصين تتصدر مصادر الواردات
وحافظت الصين على موقعها في صدارة الدول المصدّرة إلى المملكة، بحصة بلغت 21.9% من إجمالي الواردات، تلتها الولايات المتحدة الأمريكية بنسبة 8.4%، ثم مصر بنسبة 5.8%.
وأكدت الهيئة العامة للإحصاء أن بيانات التجارة الدولية السلعية لعام 2026 لا تزال أولية، وتعتمد في إعدادها على السجلات الإدارية الواردة من الجهات المختصة.
The non-oil Saudi national exports recorded a growth of 8.5% during August 2026, compared to the same month last year, in a positive indicator reflecting the continued growth of national exports away from the oil sector, and the increasing contribution of Saudi products to international trade.
The General Authority for Statistics revealed data in its report on international goods trade, showing an increase in the ratio of non-oil exports, including re-exports, to imports, reaching 36.51%, compared to 36.48% in August 2025, reflecting a slight improvement in this trade indicator.
Plastics and Chemicals at the Forefront
Plastics, rubber, and their products topped the list of non-oil exports, accounting for 22.6% of the total, after recording an annual growth of 7.5%, while chemical industry products came in second place with a share of 20.9%.
These results reflect the continued presence of Saudi industrial products in foreign markets, especially in sectors related to manufacturing and petrochemicals.
UAE, Korea, and India: Key Markets
In terms of trading partners, the United Arab Emirates topped the destinations for Saudi exports with a share of 11.4%, followed by South Korea at 11.2%, and India at 8.4%.
The top 10 export destinations accounted for 64.5% of the total goods exports of the Kingdom, reflecting the importance of these markets in Saudi foreign trade.
Jeddah Port Leads Trade Outlets
Jeddah Islamic Port emerged as the most prominent outlet for goods trade, having accounted for 46.7% of total imports, in addition to leading non-oil export outlets with a share of 27.5%, indicating its pivotal position in the transport and logistics system in the Kingdom.
Imports Decline by 9.1%
In another indicator, data showed a decline in goods imports by 9.1% during last August, while total goods exports decreased by 11.5%, affected by a 12.5% drop in oil exports.
The trade balance surplus also decreased by 21% year-on-year.
China Tops Import Sources
China maintained its position as the leading exporter to the Kingdom, with a share of 21.9% of total imports, followed by the United States at 8.4%, and Egypt at 5.8%.
The General Authority for Statistics confirmed that the data on international goods trade for 2026 is still preliminary and relies on administrative records from the relevant authorities.