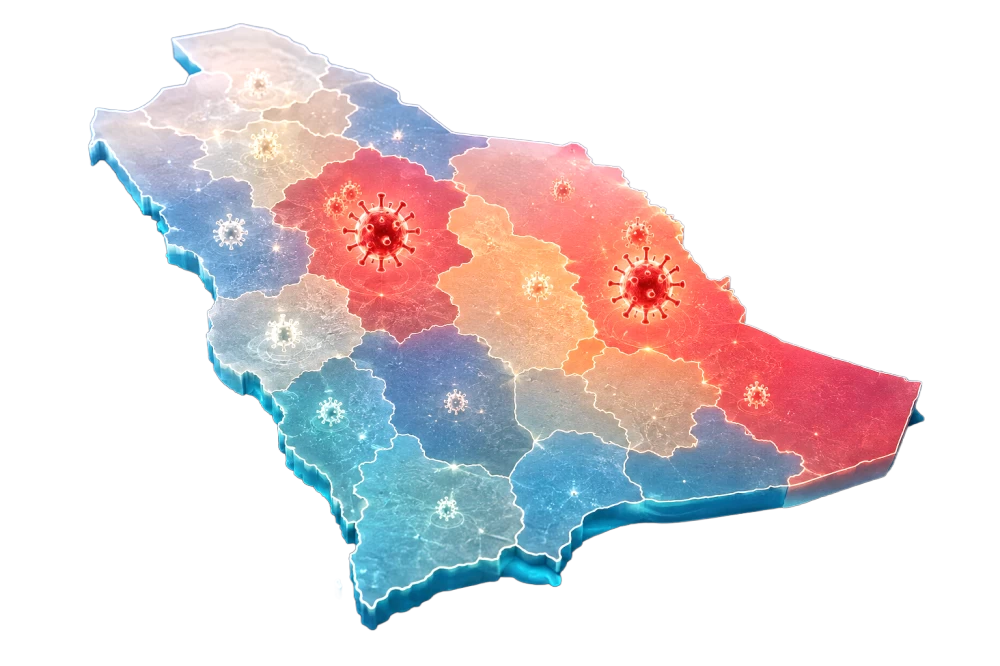
بعد أكثر من 4 أعوام على انحسار ذروة جائحة كورونا، أعادت دراسة سعودية حديثة فتح خريطة الوباء من جديد، لا لتعد الإصابات، بل لتكشف كيف تحرك الفايروس بين مناطق السعودية، وأين تشكلت بؤره الساخنة، ولماذا استحوذت الرياض ومكة المكرمة والمنطقة الشرقية وحدها على نحو 71.5% من الحالات التراكمية الواردة في بيانات الدراسة.
وأظهرت الدراسة، أن الرياض سجلت 220,868 حالة مؤكدة حتى نهاية أغسطس 2022، بما يمثل نحو 27.2% من إجمالي الحالات المدرجة في التحليل، تلتها مكة المكرمة بـ199,784 حالة (نحو 24.6%)، ثم المنطقة الشرقية بـ160,056 حالة (نحو 19.7%). ولم تكن هذه الكثافة مجرد تفوق عددي، إذ ظهرت الرياض والشرقية مرارًا بوصفهما بؤرتين ساخنتين في التحليل المكاني للوباء.
ونُشرت الدراسة في يوليو 2026، في مجلة التقارير العلمية، الصادرة عن سبرنغر نيتشر، بعنوان «التحليل المكاني والزماني للارتباط الذاتي لانتشار كوفيد 19 في مناطق السعودية»، وأعدها قسم الجغرافيا بكلية العلوم الإنسانية والاجتماعية في جامعة الملك سعود.
وعاد الباحث إلى البيانات اليومية الرسمية للإصابات والتعافي والوفيات في مناطق المملكة الـ13، خلال الفترة من 31 مارس 2020 حتى 31 أغسطس 2022، ثم حوّل الأرقام إلى خرائط زمنية ومكانية، مستخدمًا أدوات إحصائية ترصد ما إذا كانت الحالات تتجمع في مناطق متجاورة أو تنتشر عشوائيًا.
وكشفت الخريطة، أن كورونا لم يتحرك بالطريقة نفسها في جميع أنحاء المملكة، فالمراكز الأعلى كثافة سكانية والأكثر نشاطًا اقتصاديًا وحركة في النقل والتنقل دفعت الرياض والشرقية إلى صدارة البؤر الساخنة، بينما ظهرت عسير وجازان والباحة بصورة متكررة ضمن البؤر الباردة الأقل انتشارًا نسبيًا.
وخارج المناطق الثلاث الكبرى، سجلت المدينة المنورة 55,208 حالات، وعسير 53,894، وجازان 32,230، والقصيم 29,643، وحائل 14,444، ونجران 13,628، وتبوك 12,050، والباحة 10,824، والحدود الشمالية 6,936، والجوف 3,896 حالة.
وتقول قصة الأرقام، إن الوباء سلسلة أوبئة محلية صغيرة، صنعتها الكثافة السكانية، ومسارات السفر، والنشاط الاقتصادي، واتصال المدن ببعضها. فما كان يحدث في الرياض أو الشرقية لم يكن بالضرورة يتكرر بالصورة نفسها في الجنوب الغربي أو المناطق الأقل كثافة.
وخلصت الدراسة إلى أن إدارة الأوبئة القادمة يجب ألا تبدأ بإجراءات موحدة للجميع، بل بخريطة تحدد أين تتجه الأَسرَّة الطبية والمختبرات والكوادر واللقاحات أولًا.
وأوصت بدمج التحليل الجغرافي في أنظمة الإنذار المبكر، وتحديث الخرائط الوبائية باستمرار، وربطها بالكثافة السكانية والحركة والنشاط الاقتصادي والاستعداد الصحي، حتى لا تنتظر الجهات الصحية ارتفاع الأرقام بعد تفشي المرض، بل تتحرك قبل أن تتحول المنطقة إلى بؤرة ساخنة.
More than 4 years after the peak of the COVID-19 pandemic receded, a recent Saudi study has reopened the map of the epidemic, not to count infections, but to reveal how the virus moved between regions in Saudi Arabia, where its hotspots formed, and why Riyadh, Mecca, and the Eastern Province alone accounted for about 71.5% of the cumulative cases reported in the study's data.
The study showed that Riyadh recorded 220,868 confirmed cases by the end of August 2022, representing about 27.2% of the total cases included in the analysis, followed by Mecca with 199,784 cases (about 24.6%), and then the Eastern Province with 160,056 cases (about 19.7%). This density was not merely a numerical superiority, as Riyadh and the Eastern Province repeatedly appeared as hotspots in the spatial analysis of the epidemic.
The study was published in July 2026 in the journal Scientific Reports, issued by Springer Nature, titled “Spatial and Temporal Analysis of the Autocorrelation of COVID-19 Spread in Regions of Saudi Arabia,” and was prepared by the Department of Geography at the College of Humanities and Social Sciences at King Saud University.
The researcher returned to the official daily data on infections, recoveries, and deaths in the 13 regions of the Kingdom, during the period from March 31, 2020, to August 31, 2022, and then transformed the numbers into temporal and spatial maps, using statistical tools to track whether cases clustered in adjacent areas or spread randomly.
The map revealed that COVID-19 did not move in the same way throughout the Kingdom; the areas with the highest population density and the most economic activity and transportation movement pushed Riyadh and the Eastern Province to the forefront of the hotspots, while Asir, Jazan, and Al-Baha repeatedly appeared among the relatively less spread cold spots.
Outside the three major regions, Medina recorded 55,208 cases, Asir 53,894, Jazan 32,230, Al-Qassim 29,643, Ha'il 14,444, Najran 13,628, Tabuk 12,050, Al-Baha 10,824, the Northern Borders 6,936, and Al-Jawf 3,896 cases.
The story of the numbers indicates that the epidemic is a series of small local outbreaks, created by population density, travel routes, economic activity, and the connectivity of cities. What happened in Riyadh or the Eastern Province did not necessarily repeat in the same manner in the southwestern regions or the less dense areas.
The study concluded that managing future epidemics should not start with uniform measures for everyone, but with a map that determines where medical beds, laboratories, personnel, and vaccines should be directed first.
It recommended integrating geographic analysis into early warning systems, continuously updating epidemic maps, and linking them to population density, movement, economic activity, and health preparedness, so that health authorities do not wait for numbers to rise after an outbreak, but act before an area turns into a hotspot.